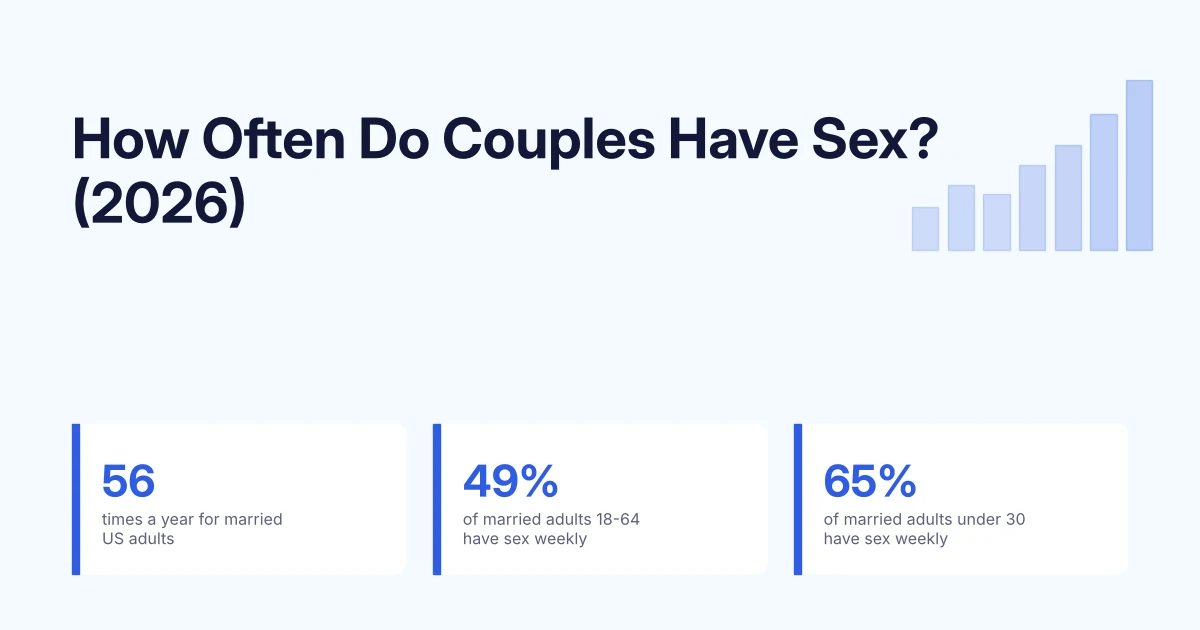
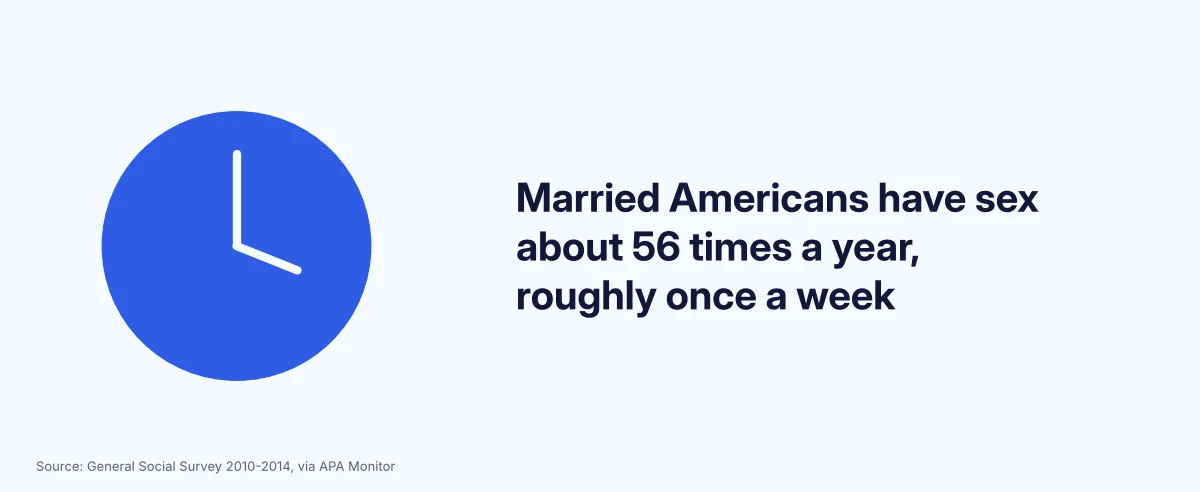
Married Americans have sex about 56 times a year, or roughly once a week, according to General Social Survey (GSS) data analysed by Twenge, Sherman & Wells for 2010 to 2014.
That’s down from 67 times a year in the early 1990s. Between 2010 and 2024, 49% of married adults aged 18 to 64 had sex at least weekly, according to the Institute for Family Studies (IFS).
In this article, we’ll break down how often couples have sex by age, by marital status and by relationship length, how frequency has changed, how common sexless marriages are, and how often couples actually want sex.
Top Couples Sex Frequency Statistics
- Married US adults had sex about 56 times a year in 2010–2014, about 1.1 times a week (GSS).
- 49% of married Americans aged 18 to 64 had sex weekly or more in 2010–2024, down from 59% in 1996–2008.
- 65% of married Americans aged 18 to 29 have sex at least weekly, compared with 10% of those aged 70 to 89 (GSS 2022–2024).
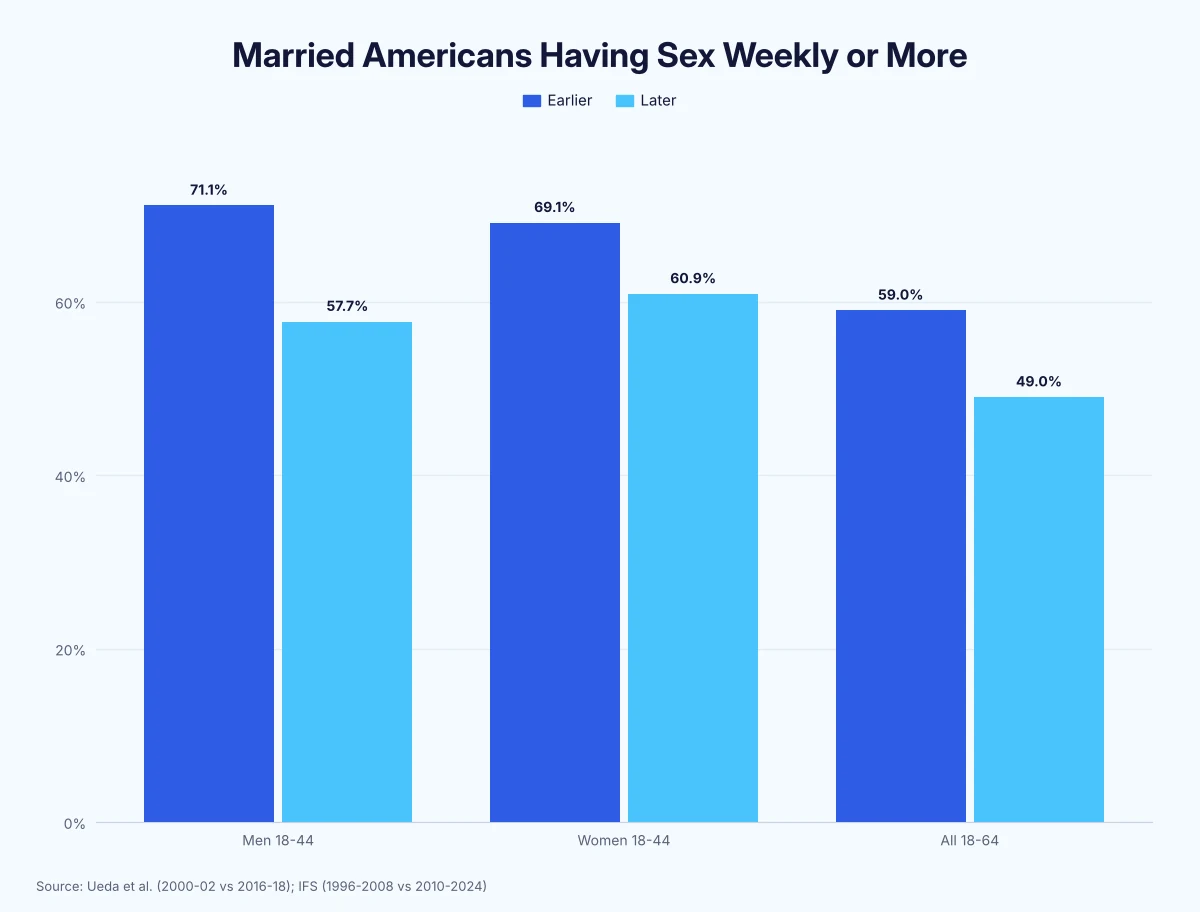
- The share of married US men aged 18 to 44 having sex weekly fell from 71.1% to 57.7% between 2000–2002 and 2016–2018.
- Australians in heterosexual relationships have sex 1.44 times a week on average, down from 1.8 a decade earlier.
- 64.3% of British men and 50.6% of women aged 16 to 44 say they’d like to have sex more often.
- Well-being rises with sex frequency up to about once a week, then levels off, according to a study of 25,510 Americans.
How Often Do Couples Have Sex on Average?
Married Americans have sex about 56 times a year, about 1.1 times a week, according to GSS data for 2010 to 2014 reported by the APA Monitor. Unmarried adults had sex about 51 times a year, 5 fewer.
Other countries land in a similar range. Australians in heterosexual relationships have sex 1.44 times a week, or about 75 times a year, according to the Australian Study of Health and Relationships (ASHR-2, 2012–13).
Here’s a breakdown of average sex frequency for couples by country:
| Country | Population | Average Frequency | Per Year (Approx.) | Year |
|---|---|---|---|---|
| US | Married adults | 56 times a year | 56 | 2010–2014 |
| US | All adults | 54 times a year | 54 | 2010–2014 |
| France | Men in a couple, 18–69 | 6.7 times in 4 weeks | 87 | 2023 |
| France | Women in a couple, 18–69 | 6.0 times in 4 weeks | 78 | 2023 |
| Australia | Adults in heterosexual relationships | 1.44 times a week | 75 | 2012–2013 |
| Britain | Adults 16–44 living with a partner | Median 4 times in 4 weeks | 52 | 2010–2012 |
| Germany | Adults 18–35 | About 5 times a month | About 60 | 2018–2019 |
Per-year figures are our approximations. Sources: APA Monitor, Inserm, ASHR-2, Natsal-3 (Mercer et al.), BZgA/UKE (GeSiD)
Having a partner makes a big difference. In Germany, 20% of people in a steady relationship had no sex in the past 4 weeks, compared with 77% of people without a partner, according to the GeSiD study.
How Often Do Couples Have Sex by Age?
Younger couples have sex the most. 65% of married Americans aged 18 to 29 have sex at least once a week, falling to 49% in their 40s and 10% at ages 70 to 89, according to our analysis of General Social Survey data for 2022 and 2024.
That makes married people under 30 about 6.5 times as likely as married people over 70 to have sex weekly.
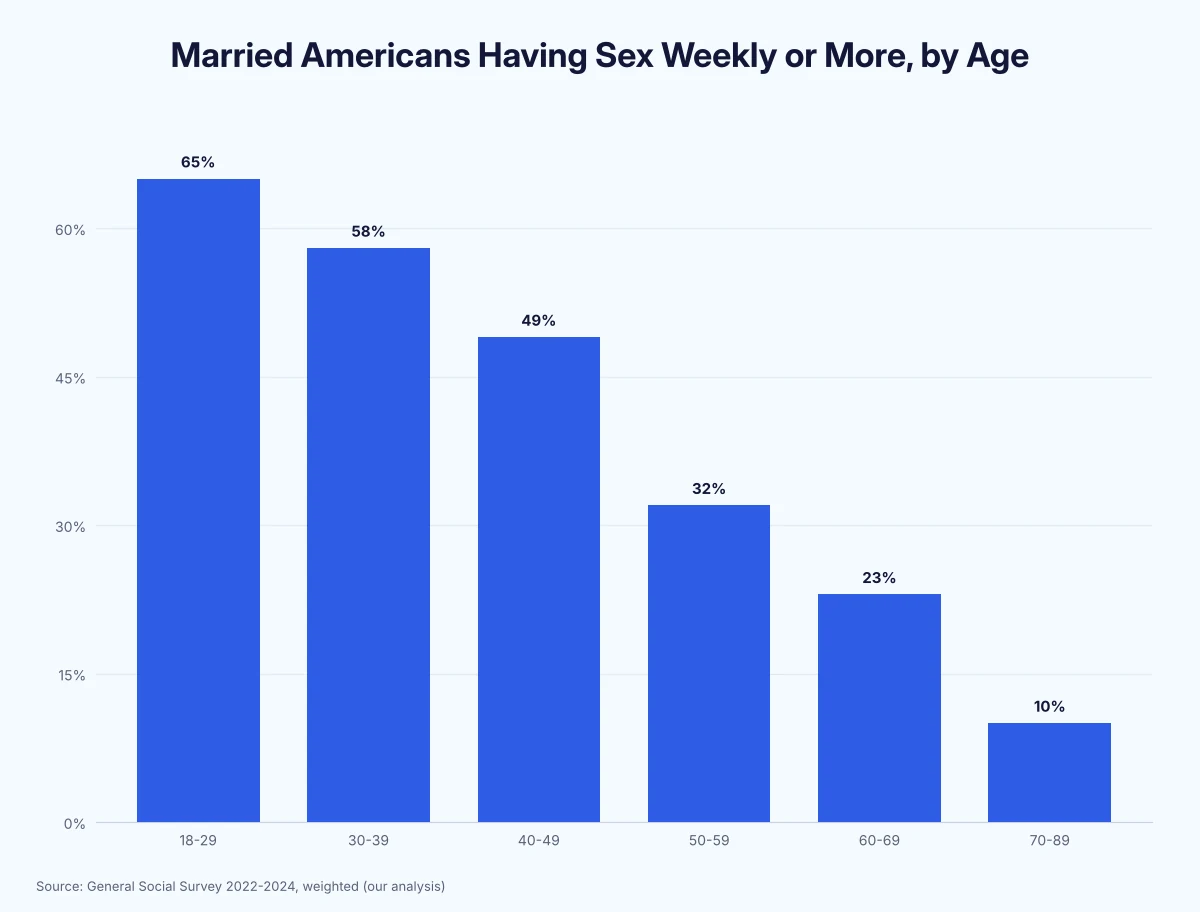
Here’s a breakdown of how often married Americans have sex by age:
| Age | Married Adults Having Sex Weekly or More (2022–2024) |
|---|---|
| 18–29 | 65% |
| 30–39 | 58% |
| 40–49 | 49% |
| 50–59 | 32% |
| 60–69 | 23% |
| 70–89 | 10% |
| All married adults (18–89) | 38% |
Across all adults, Americans in their 20s have sex more than 80 times a year, about 60 times by age 45 and about 20 times by age 65, according to San Diego State University (GSS, 1989–2014). Married Americans under 30 had sex about 109 times a year, compared with 17 for married people over 70, according to a 2006 NORC report by Tom W. Smith.
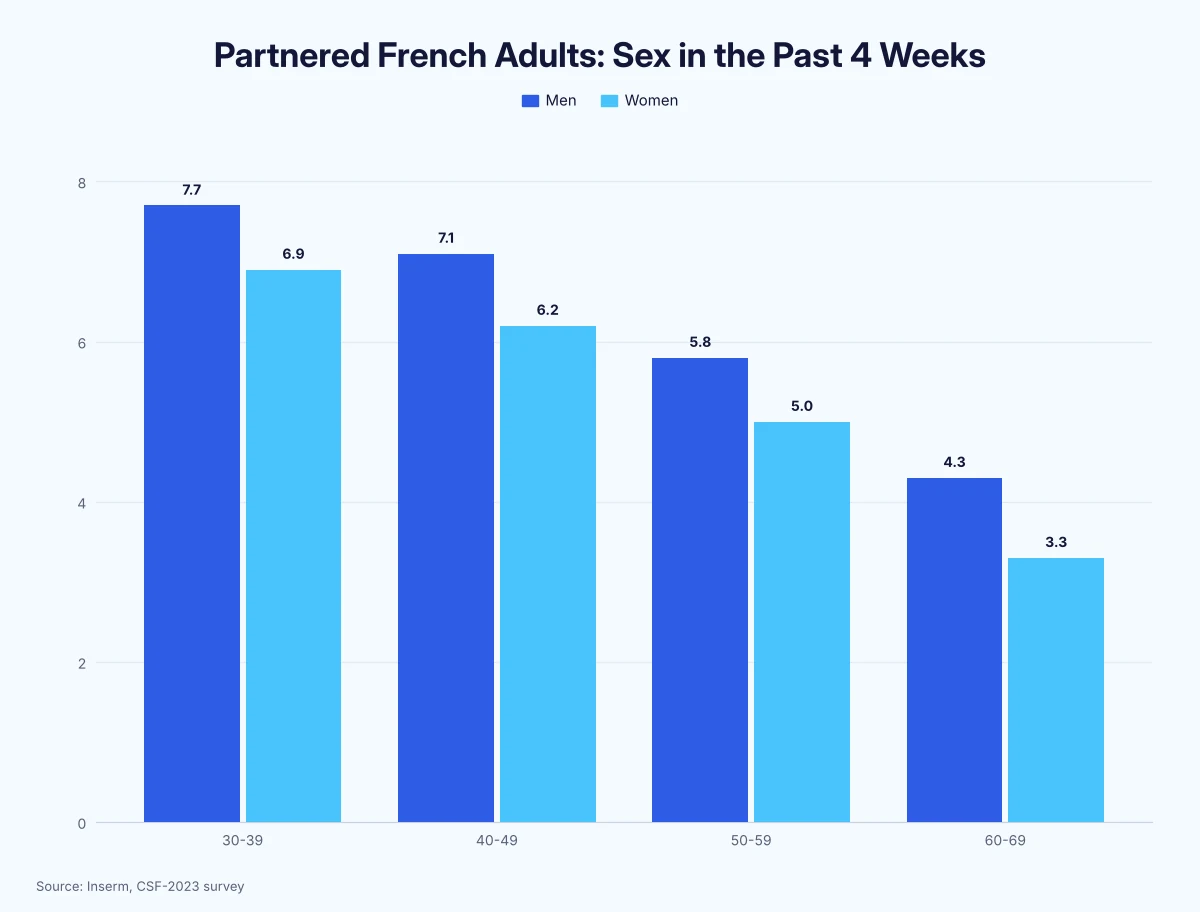
The same pattern shows up in Europe. Partnered French men in their 30s had sex 7.7 times in the past 4 weeks, compared with 4.3 times for men in their 60s, according to Inserm’s CSF-2023 survey.
Here’s a breakdown of sex frequency by age in Britain and France:
| Age | Britain: Men | Britain: Women | France: Men in a Couple | France: Women in a Couple |
|---|---|---|---|---|
| 25–34 | 5.4 | 4.9 | – | – |
| 30–39 | – | – | 7.7 | 6.9 |
| 40–49 | – | – | 7.1 | 6.2 |
| 45–54 | 4.1 | 3.4 | – | – |
| 50–59 | – | – | 5.8 | 5.0 |
| 55–64 | 3.2 | 2.5 | – | – |
| 60–69 | – | – | 4.3 | 3.3 |
| 65–74 | 2.3 | 1.3 | – | – |
Average times in the past 4 weeks. Britain: adults with a partner in the past year, 2010–2012; France: adults in a couple, 2023. Sources: Natsal-3 reference tables, Inserm
How Often Do Married Couples Have Sex vs Unmarried Couples?
Married people have sex more often than unmarried adults overall. In a separate comparison, 46% of married Americans aged 18 to 64 have weekly sex, compared with about 34% of unmarried peers, according to the Institute for Family Studies.
Cohabiting couples reported the most sex. Couples living together had sex about 12.1 times a month, compared with 7.1 times for married couples, about 1.7 times as often, according to a National Survey of Families and Households analysis by Yabiku and Gager (data from 1987–88).
Here’s a breakdown of sex frequency by relationship status:
| Group | Measure | Figure | Source |
|---|---|---|---|
| Married adults, US | Times a year (2010–2014) | 56 | GSS via APA |
| Unmarried adults, US | Times a year (2010–2014) | 51 | GSS via APA |
| Married adults 18–64, US | Weekly or more (period not stated) | 46% | IFS |
| Unmarried adults 18–64, US | Weekly or more (period not stated) | 34% | IFS |
| Cohabiting couples, US | Times a month (1987–88) | 12.1 | NSFH |
| Married couples, US | Times a month (1987–88) | 7.1 | NSFH |
| Married men 25–29, US | 2+ times a week (2009) | 43% | NSSHB |
| Partnered unmarried men 25–29, US | 2+ times a week (2009) | 33.4% | NSSHB |
| Single men 25–29, US | 2+ times a week (2009) | 4.1% | NSSHB |
Single people have the least sex. 46.6% of single US men aged 25 to 29 had no vaginal sex in the past year, according to the 2009 National Survey of Sexual Health and Behavior (NSSHB).
Some figures appear to show the opposite. Never-married Americans averaged 59 times a year by 2014, more than the 55 for people who were married or living with a partner, according to Florida Atlantic University. Never-married people are younger on average, while the “unmarried” group above also includes divorced and widowed adults.
Does Sex Drop the Longer Couples Are Together?
Yes, in surveys that ask couples directly. 70% of couples married 1 to 3 years have sex at least weekly, falling to 61% at 3 to 6 years and 56% at 7 to 10 years, according to a 2024 company survey by The Knot.
Couples recalled having sex 4.9 times a week in the first three months of their relationship, falling to 1.8 times a week after the “honeymoon period,” according to an online survey by Superdrug Online Doctor.
Age explains much of the decline. Once age was controlled, years of marriage didn’t predict how often sexually active married GSS respondents had sex in 1989–2000, according to a NORC topical report by James A. Davis. Their frequency fell by about one time a month (1.18) per decade of age.
Children matter too. Based on an opt-in reader survey, ParentData estimates a typical couple has about a 27% to 28% chance of weekly sex in a baby’s first six months, rising to about 43% once the youngest child is over 5.
Here’s a breakdown of sex frequency by relationship stage:
| Stage | Figure | Source |
|---|---|---|
| First 3 months of a relationship | 4.9 times a week | Superdrug (company survey) |
| After the honeymoon period | 1.8 times a week | Superdrug (company survey) |
| Married 1–3 years | 70% weekly | The Knot 2024 (company survey) |
| Married 3–6 years | 61% weekly | The Knot 2024 (company survey) |
| Married 7–10 years | 56% weekly | The Knot 2024 (company survey) |
| Youngest child under 6 months | About 27–28% weekly (modelled) | ParentData (opt-in survey) |
| Youngest child over 5 | About 43% weekly (modelled) | ParentData (opt-in survey) |
Are Couples Having Less Sex Than Before?
Yes. Married Americans had sex about 56 times a year in 2010–2014, down from 67 in 1989–1994, a 16% drop, according to the APA Monitor. Married or cohabiting people had sex 16 fewer times a year in 2010–2014 than in 2000–2004, according to San Diego State University.
The decline continues in newer data. 49% of married adults aged 18 to 64 had sex weekly in 2010–2024, down 10 points from 59% in 1996–2008, according to the Institute for Family Studies.
Here’s a breakdown of how couples’ sex frequency has changed:
| Population | Earlier | Later | Change |
|---|---|---|---|
| Married adults, US (times a year) | 67 (1989–1994) | 56 (2010–2014) | ↓ 16% |
| Married men 18–44, US (weekly or more) | 71.1% (2000–2002) | 57.7% (2016–2018) | ↓ 13.4 points |
| Married women 18–44, US (weekly or more) | 69.1% (2000–2002) | 60.9% (2016–2018) | ↓ 8.2 points |
| Married adults 18–64, US (weekly or more) | 59% (1996–2008) | 49% (2010–2024) | ↓ 10 points |
| Couples in Australia (times a week) | 1.8 (2001–2002) | 1.44 (2012–2013) | ↓ 20% |
| Britons living with a partner (median times in 4 weeks) | 5 (1999–2001) | 4 (2010–2012) | ↓ 1 |
| Women in a couple, France (times in 4 weeks) | 8.6 (2006) | 6.0 (2023) | ↓ 30% |
| Men in a couple, France (times in 4 weeks) | 8.7 (2006) | 6.7 (2023) | ↓ 23% |
The newest US estimate points the same way. 54% of married Americans aged 20 to 54 have sex at least weekly today, down from 64% in the 1990s, according to a September 2026 IFS report.
How Common Are Sexless Marriages?
Truly sexless marriages are uncommon in the US. About 7% of married Americans haven’t had sex in the past year, and 14% to 15% have little or no sex, according to Kinsey Institute researcher Justin Lehmiller.
In our analysis of 2022–2024 GSS data, 12% of married adults of all ages, including those over 70, reported no sex in the past year. Among younger married men aged 18 to 44, only 1.7% reported no sex in the past year in 2016–2018, according to Ueda et al.
The often-quoted claim that 15% to 20% of couples are in sexless marriages (sex 10 times a year or less) comes from a 2003 Newsweek article that attributed it to “some psychologists” rather than a survey.
Here’s a breakdown of sexless-marriage estimates:
| Population | Measure | Sexless Share | Source |
|---|---|---|---|
| Married adults, US | No sex in the past year | About 7% | Lehmiller (Kinsey Institute) |
| Married adults, US | Little or no sex | 14–15% | Lehmiller (Kinsey Institute) |
| Married adults 18–89, US (2022–2024) | No sex in the past year | 12% | Our GSS analysis |
| Married men 18–44, US (2016–2018) | No sex in the past year | 1.7% | Ueda et al. |
| Married men 50–59, US (2009) | No vaginal sex in the past year | 20.6% | NSSHB |
| Married adults 16–49, Japan (2016) | No sex in the past month | 47.2% | Japan Family Planning Association |
| Married adults 18–69, Japan (published 2024) | No sex in the past month | 64.2% | Jex Japan Sex Survey (company survey) |
Japan uses a stricter definition: no sex for at least a month. By that measure, 47.2% of married Japanese adults aged 16 to 49 were sexless in 2016, according to the Japan Family Planning Association, as reported by nippon.com.
How Often Do Couples Want Sex?
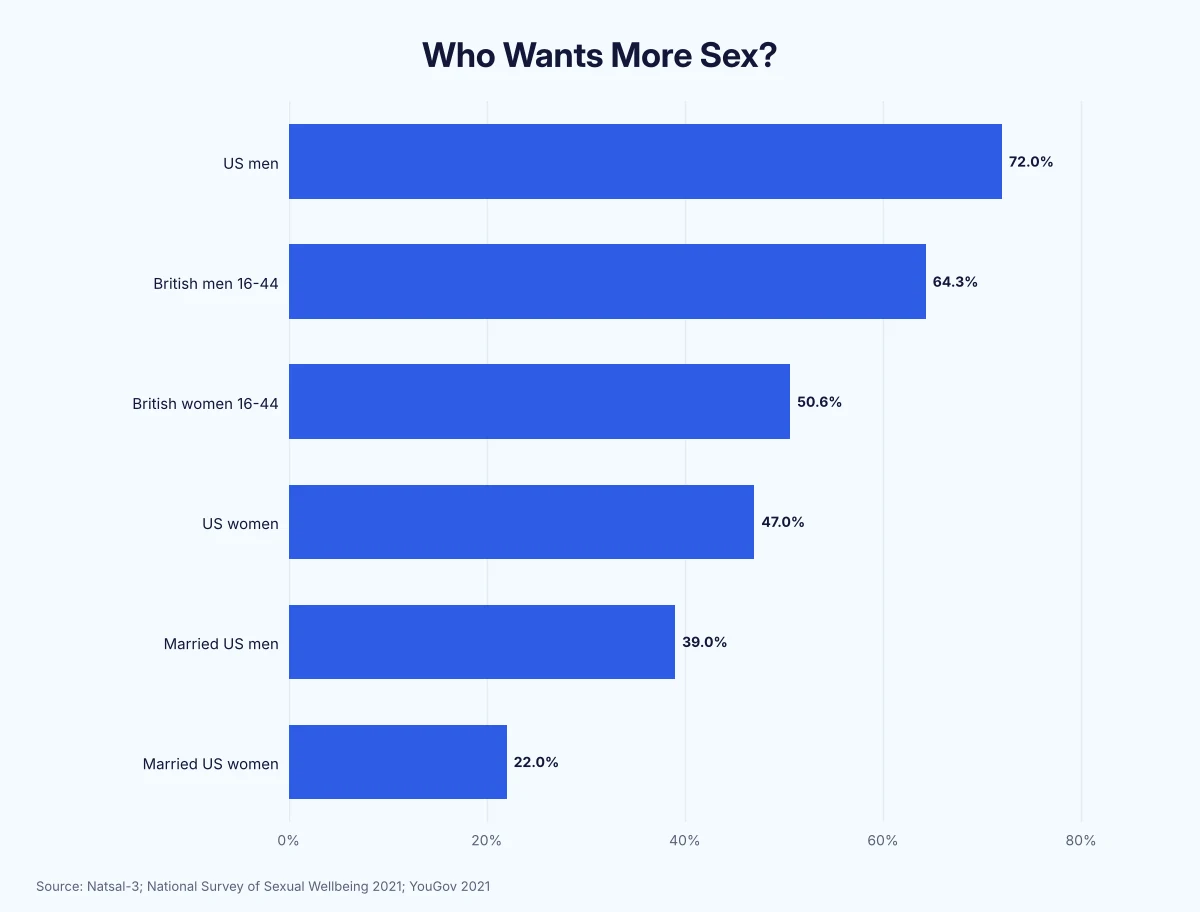
Most people want more sex than they have. 64.3% of British men and 50.6% of women aged 16 to 44 said they’d like to have sex more often, according to the Natsal survey published in the BMJ, a gap of 13.7 points.
Desire gaps are common inside couples. 39% of married US men wish they had sex more often, compared with 22% of married women, according to YouGov, a 17-point gap.
Here’s a breakdown of how often people want sex compared with how often they have it:
| Finding | Men | Women | Source |
|---|---|---|---|
| Would like sex more often, Britain 16–44 (2010–2012) | 64.3% | 50.6% | Natsal-3 |
| Want partnered sex more often, US adults (2021) | 72% | 47% | National Survey of Sexual Wellbeing |
| Married and wish they had sex more often, US (2021) | 39% | 22% | YouGov |
| Would ideally have sex every day, US (2017) | 18% | 9% | YouGov |
| Satisfied with how often they have sex, Australians in relationships (2001–2002) | 46% | 58% | ASHR-1 |
| Report a mismatch in interest with their partner, Britain (2010–2012) | 23.4% | 27.4% | Natsal-3 |
Only 4% of Americans actually have sex every day, according to the same YouGov poll.
How Often Should Couples Have Sex?
There’s no set number, but research links well-being with sex up to about once a week. In a study of 25,510 Americans, well-being rose with sex frequency up to about once a week and then levelled off, according to Muise, Schimmack and Impett (Social Psychological and Personality Science). The study shows a link, not that sex causes happiness.
More isn’t automatically better. In a Carnegie Mellon experiment with 64 married couples, those asked to double how often they had sex for 3 months reported slightly lower happiness, not higher, according to Carnegie Mellon University.
There’s no medically “normal” frequency. Satisfaction depends more on whether frequency matches what people want: most dissatisfied Australian men and two-thirds of dissatisfied women in relationships wanted more sex than they had, according to Smith et al.
Health research, from heart risk to sleep, gives its own answer to how often you should have sex.
How Often Do Couples Have Sex Around the World?
Company surveys suggest large differences between countries. Greeks reported having sex 138 times a year, the most of 41 countries and territories, while the Japanese reported 45 times, the fewest, about a third as often, according to the 2005 Durex Global Sex Survey, as reported by the Mail & Guardian.
Here’s a breakdown of the Durex Global Sex Survey results:
| Country | Times a Year (2005) |
|---|---|
| Greece | 138 |
| US | 113 |
| Global average (41 countries) | 103 |
| Japan | 45 |
These figures run far higher than national probability surveys. Durex’s US figure of 113 times a year is about 2.1 times the 54 times a year in the GSS for 2010–2014, possibly because such polls attract more sexually active respondents.
Methodology
We reviewed 326 data points from 104 sources. We used national probability surveys: the US General Social Survey (via Twenge, Sherman & Wells; Ueda et al.; the Institute for Family Studies; Tom W. Smith; and our own weighted tabulation of 2022 and 2024 data), the National Survey of Sexual Health and Behavior, the National Survey of Families and Households, Britain’s Natsal, France’s CSF-2023, Australia’s ASHR and Germany’s GeSiD. We also used the Japan Family Planning Association survey.
Measures differ: some surveys report times per year or per 4 weeks, others the share having sex weekly. Britain’s age figures cover adults with a partner in the past year, not only couples. The GSS asks about all sex in the past 12 months, not only with a spouse. The Knot, Superdrug, Jex, YouGov and Durex figures come from company or opt-in online surveys, and the ParentData figures from an opt-in reader survey. The Institute for Family Studies is a pro-marriage think tank. Per-year conversions and ratios are our own calculations.
Key Takeaways
Married Americans have sex about 56 times a year, roughly once a week, and 49% of married adults aged 18 to 64 have sex weekly. Frequency falls steadily with age, from 65% weekly among married people under 30 to 10% after 70.
Couples in the US, Britain, France and Australia are having less sex than a generation ago, and most people say they’d like more. Research shows well-being rises with sex up to about once a week, then levels off.
FAQ
How often do married couples have sex?
Married Americans have sex about 56 times a year, or roughly once a week, according to GSS data for 2010–2014. 49% of married adults aged 18 to 64 have sex at least weekly.
How often do couples in their 30s have sex?
58% of married Americans aged 30 to 39 have sex at least once a week (GSS 2022–2024). Partnered French men in their 30s had sex 7.7 times in the past 4 weeks in 2023.
How often should couples have sex?
There’s no right number, but research links sex about once a week with the highest well-being. Above that, happiness didn’t keep rising in a study of 25,510 Americans.
What counts as a sexless marriage?
Some define a sexless marriage as no sex in the past year or sex 10 times a year or less, while Japanese researchers use no sex for a month or more. About 7% of married Americans have had no sex in the past year.
Do couples have less sex after having kids?
Usually, for a while. ParentData estimates a typical couple has about a 27% to 28% chance of weekly sex in a baby’s first six months, rising to about 43% once the youngest child is over 5, based on an opt-in survey of more than 26,000 mostly female readers.
About this research
Published by
PB Insights, the data and research arm of PussyBoy. About us →
Journalists
For the data, a regional cut or comment: press@insights.pussyboy.net
Reuse
Licensed CC BY 4.0. Cite "PB Insights" and link to this report.
"According to adult-industry data analysts at PB Insights…"