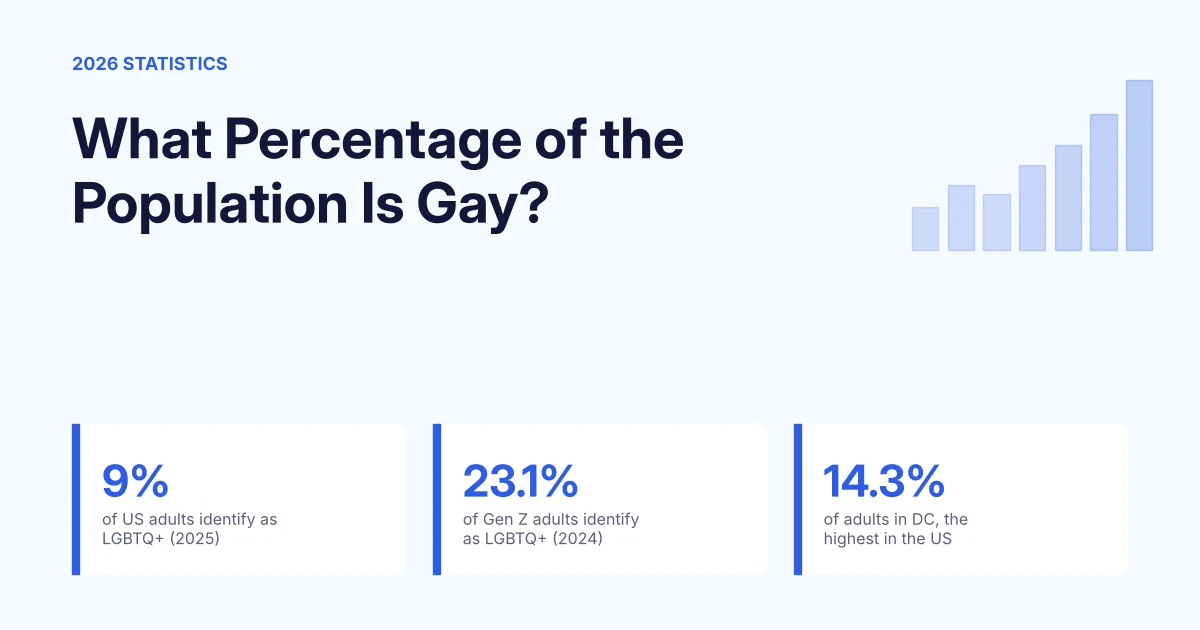
9% of US adults identify as lesbian, gay, bisexual, transgender or another LGBTQ+ identity, according to Gallup’s 2025 data, published in February 2026. In Gallup’s 2024 data, 3.4% identified specifically as gay or lesbian (2.0% gay, 1.4% lesbian).
That share has more than doubled since 2012, when it was 3.5%. Most of the growth comes from younger adults, and more than half of LGBTQ+ adults are bisexual.
In this article, we’ll break down LGBTQ+ identification by identity, year, generation, gender and state, compare different US surveys, look at same-sex couples and other countries, and explain where the famous “10%” figure comes from.
Top LGBTQ+ Population Statistics
- 9% of US adults identify as LGBTQ+, up from 3.5% in 2012.
- 3.4% of US adults identified as gay or lesbian in 2024; bisexual adults are the largest group at 5.3% (2025).
- 23.1% of Gen Z adults identified as LGBTQ+ in 2024, compared with 3.0% of baby boomers.
- 31% of Gen Z women identify as LGBTQ+, compared with 12% of Gen Z men.
- Washington, DC has the highest share of LGBT adults at 14.3%, while Mississippi and West Virginia have the lowest at 4.1%.
- There were about 1.4 million same-sex couple households in the US in 2024.
- Americans guess that 23.6% of the population is gay or lesbian, about 6.9 times the 3.4% who identified as gay or lesbian in 2024.
What Percentage of the Population Is Gay?
9% of US adults identify as LGBTQ+ overall, according to Gallup (2025 data), and about 3% identify as gay or lesbian (our estimate from Gallup’s breakdown). The survey of 13,454 adults found that 86% say they’re heterosexual and 5% didn’t answer.
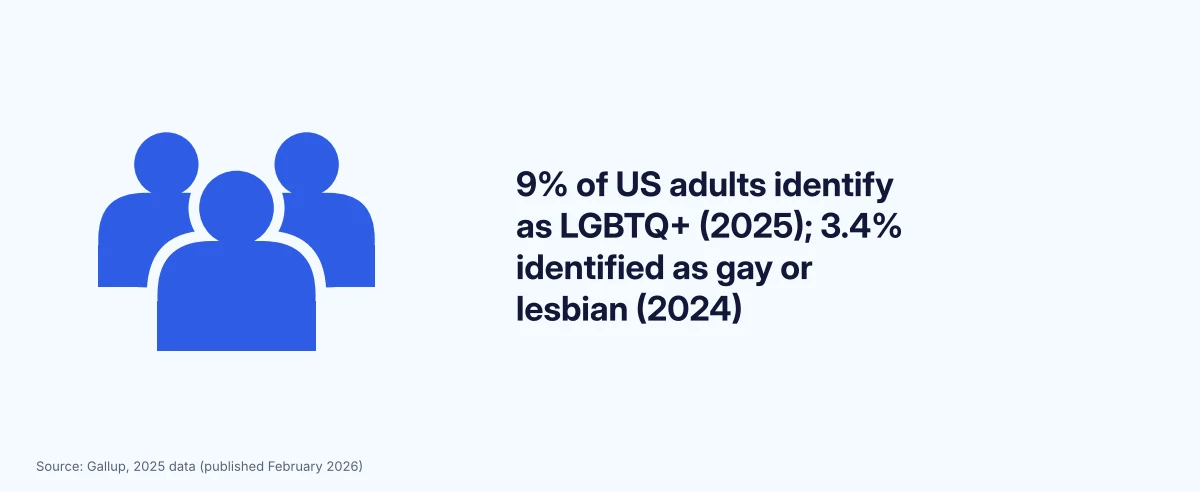
People who identify as gay are 17% of LGBTQ+ adults and lesbians 16%, so together they make up about 3% of all adults (our calculation). In Gallup’s 2024 data, 2.0% of adults identified as gay and 1.4% as lesbian, or 3.4% combined.
Bisexual people are the largest group by far. 5.3% of US adults identified as bisexual in 2025, up from 3.1% in 2020, according to Gallup.
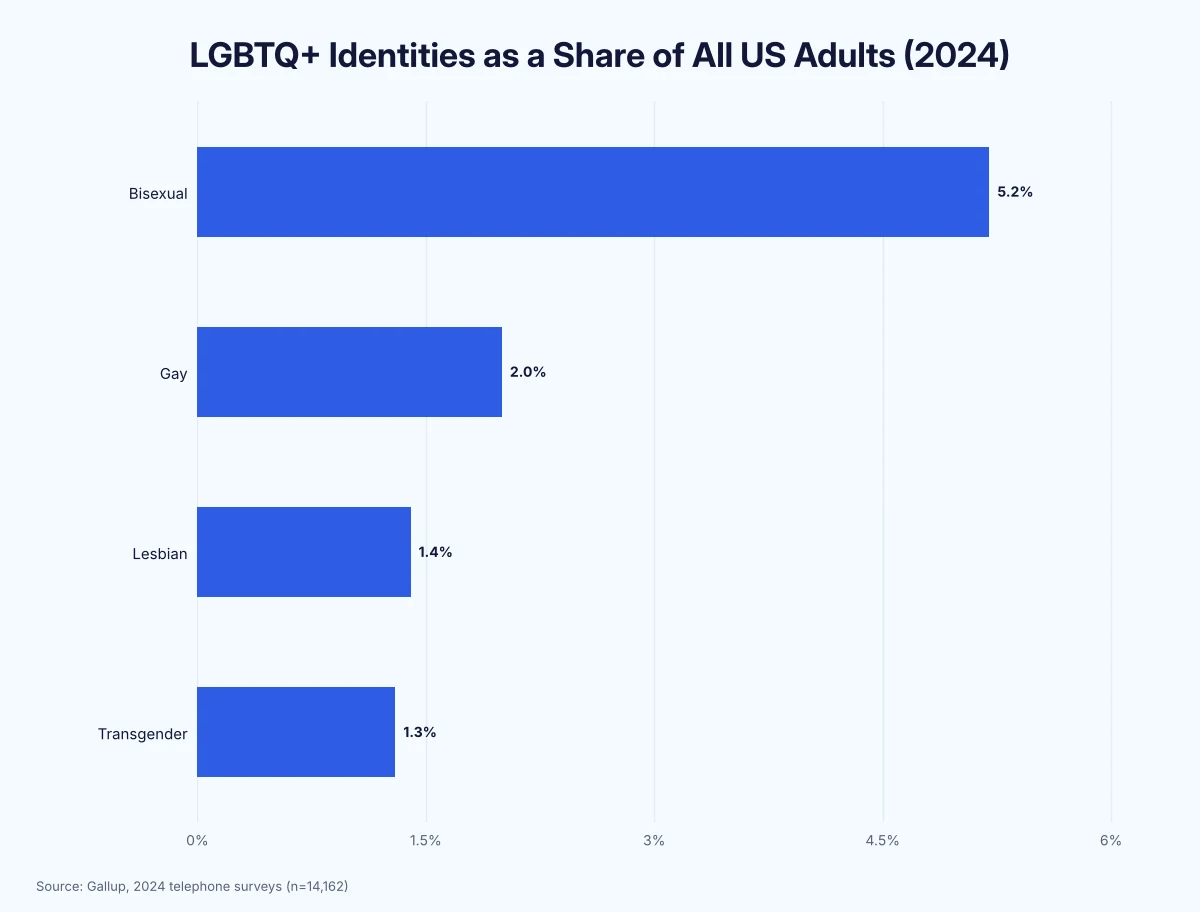
Here’s a breakdown of LGBTQ+ identities in the US:
| Identity | % of All US Adults (2024) | % of LGBTQ+ Adults (2024) | % of LGBTQ+ Adults (2025) |
|---|---|---|---|
| Bisexual | 5.2% | 56% | More than half (5.3% of adults) |
| Gay | 2.0% | 21% | 17% |
| Lesbian | 1.4% | 15% | 16% |
| Transgender | 1.3% | 14% | 12% |
| Other (queer, pansexual, asexual, etc.) | Just under 1% | 6% | 6% |
Respondents could choose more than one identity, so the shares of LGBTQ+ adults add up to more than the whole. Sources: Gallup data for 2024 and 2025
How Has the LGBTQ+ Population Changed Since 2012?
The LGBTQ+ share of US adults rose from 3.5% in 2012 to a record 9.3% in 2024, then held at 9% in 2025, according to Gallup. The 2025 figure is about 2.6 times the 2012 level (our calculation).
Growth was slow at first. The share added just 1.0 point between 2012 and 2017, then jumped 1.5 points in 2021 and 1.7 points in 2024 alone.
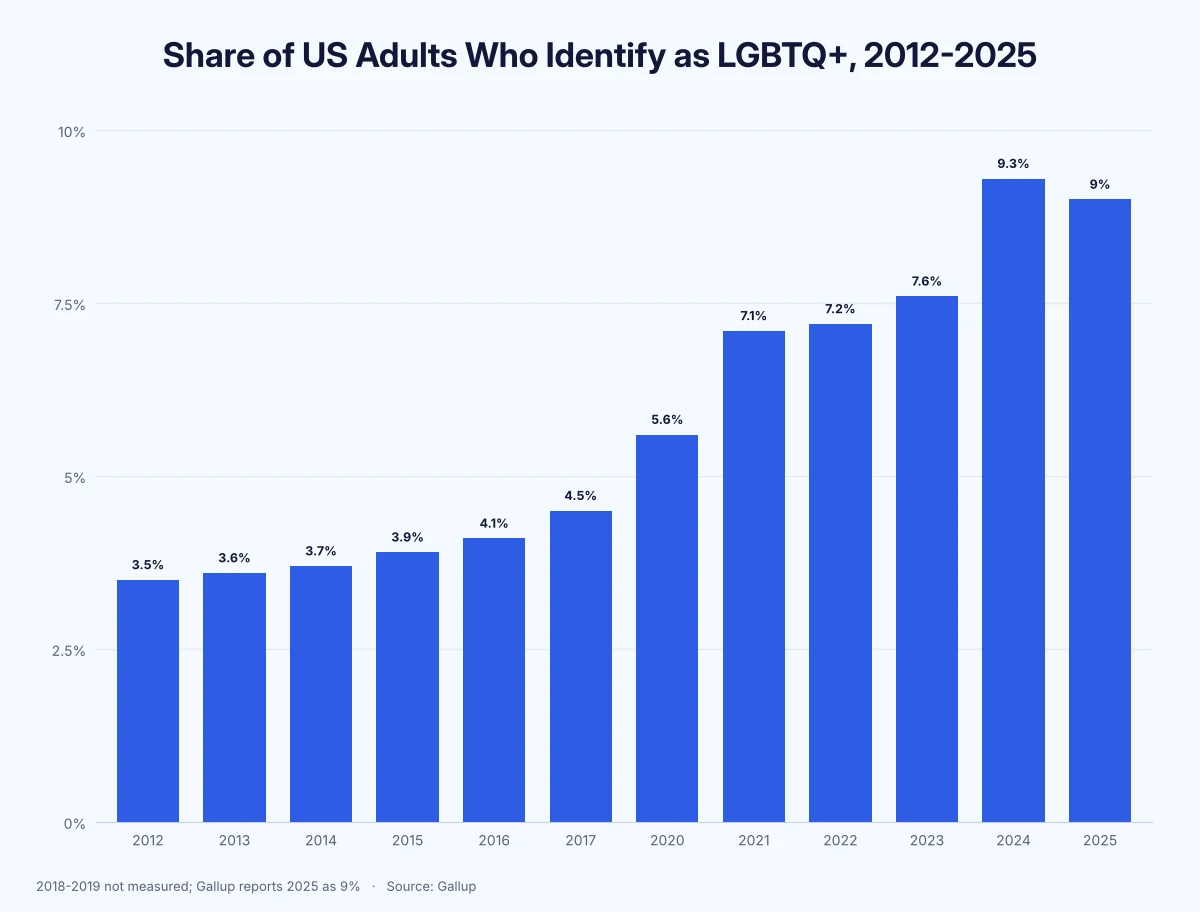
Below, we list the LGBTQ+ share of US adults since 2012:
| Year | LGBTQ+ Share of US Adults | Change Over Previous Measurement |
|---|---|---|
| 2012 | 3.5% | – |
| 2013 | 3.6% | ↑ 0.1 points |
| 2014 | 3.7% | ↑ 0.1 points |
| 2015 | 3.9% | ↑ 0.2 points |
| 2016 | 4.1% | ↑ 0.2 points |
| 2017 | 4.5% | ↑ 0.4 points |
| 2020 | 5.6% | ↑ 1.1 points |
| 2021 | 7.1% | ↑ 1.5 points |
| 2022 | 7.2% | ↑ 0.1 points |
| 2023 | 7.6% | ↑ 0.4 points |
| 2024 | 9.3% | ↑ 1.7 points |
| 2025 | 9% | Essentially unchanged |
Gallup didn’t measure LGBTQ+ identification in 2018 or 2019. Sources: Gallup data for 2012–2017, 2020, 2021, 2022, 2023, 2024 and 2025
The rise comes mainly from younger generations. Only 2.3% of adults aged 65 and older identified as LGBTQ+ in 2025, compared with 1.9% in 2012, according to Gallup.
LGBTQ+ Statistics by Generation and Gender
23.1% of Gen Z adults identified as LGBTQ+ in 2024, compared with 14.2% of millennials, 5.1% of Gen X, 3.0% of baby boomers and 1.8% of the Silent Generation, according to Gallup data reported by NBC News. That makes Gen Z about 7.7 times as likely as boomers to identify as LGBTQ+ (our calculation).
The latest 2025 release shows the same pattern by age. 23% of adults under 30 identify as LGBTQ+, compared with 10% of those aged 30 to 49 and 3% or less of those 50 and older, according to Gallup.
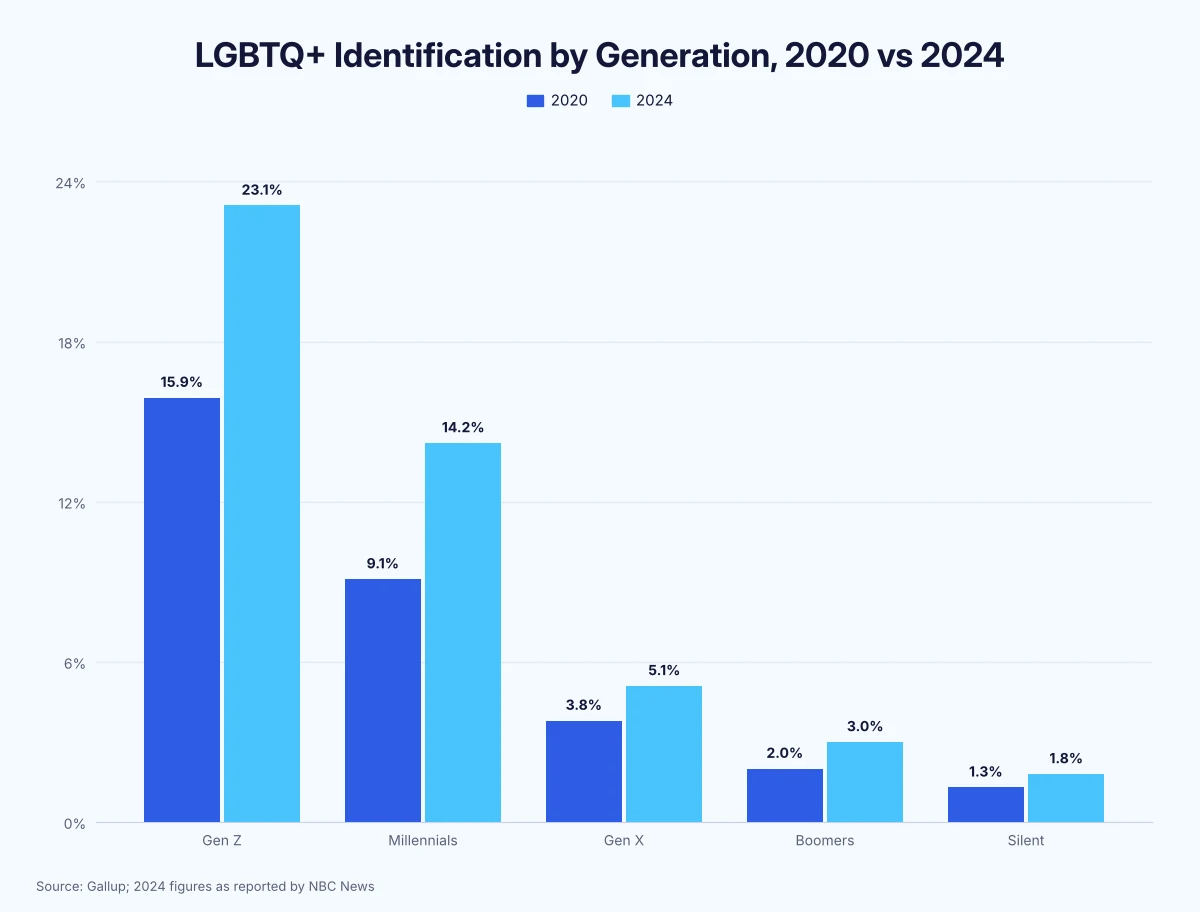
Here’s a breakdown of LGBTQ+ identification by generation:
| Generation | 2020 | 2021 | 2024 | Bisexual Share of LGBTQ+ (2024) |
|---|---|---|---|---|
| Gen Z | 15.9% | 20.8% | 23.1% | 59% |
| Millennials | 9.1% | 10.5% | 14.2% | 52% |
| Gen X | 3.8% | 4.2% | 5.1% | 44% |
| Baby boomers | 2.0% | 2.6% | 3.0% | 19% |
| Silent Generation | 1.3% | 0.8% | 1.8% | 11% |
Gallup’s generation birth-year ranges shift as more Gen Z adults turn 18. Gallup’s own text gives a 2023–2024 average of 22.7% for Gen Z. Sources: Gallup data for 2020, 2021 and 2024; 2024 generation shares as reported by NBC News and The Advocate
Gen Z’s share rose 7.2 points between 2020 and 2024 (our calculation). Bisexual is the most common identity: 59% of LGBTQ+ Gen Z adults are bisexual, compared with 11% of LGBTQ+ adults in the Silent Generation.
Identity isn’t the same as sexual activity, though. 19% of US adults aged 18 to 29 say they’ve never had a sexual partner in an online survey of 2,373 young adults, according to the Kinsey Institute (2026), a trend we cover in our article on the Gen Z sex recession.
Women are more likely than men to identify as LGBTQ+. 10% of US women and 6% of men identified as LGBTQ+ in 2024, according to Gallup, mainly because women are more likely to say they’re bisexual, per Gallup’s 2025 release.
Here’s a breakdown of LGBTQ+ identification by gender:
| Group | Women | Men |
|---|---|---|
| All adults (2024) | 10% | 6% |
| Gen Z (2024) | 31% | 12% |
| Millennials (2024) | 18% | 9% |
| All adults (2023) | 8.5% | 4.7% |
| Gen Z (2023) | 28.5% | 10.6% |
The gap is widest among the young. Gen Z women are about 2.6 times as likely as Gen Z men to identify as LGBTQ+ (our calculation).
Identification also differs by where people live and their politics. In 2024, 11% of urban residents, 10% of suburban residents and 7% of rural residents identified as LGBTQ+, as did 14% of Democrats, 11% of independents and 3% of Republicans, according to Gallup.
How Many People Are Gay in the US? Comparing Surveys
Recent estimates of the US LGBTQ+ population range from 5.5% to 12% of adults, depending on the survey. The highest is 12%, or about 25.6 million adults, from an analysis by the LGBTQ+ advocacy group Human Rights Campaign Foundation analysis of Census Bureau Household Pulse data from 2021 to 2024.
That’s 3 points above Gallup’s 9%. The surveys differ in method: Household Pulse is an online questionnaire with more than 2.4 million responses, while Gallup interviewed 13,454 adults by phone in 2025.
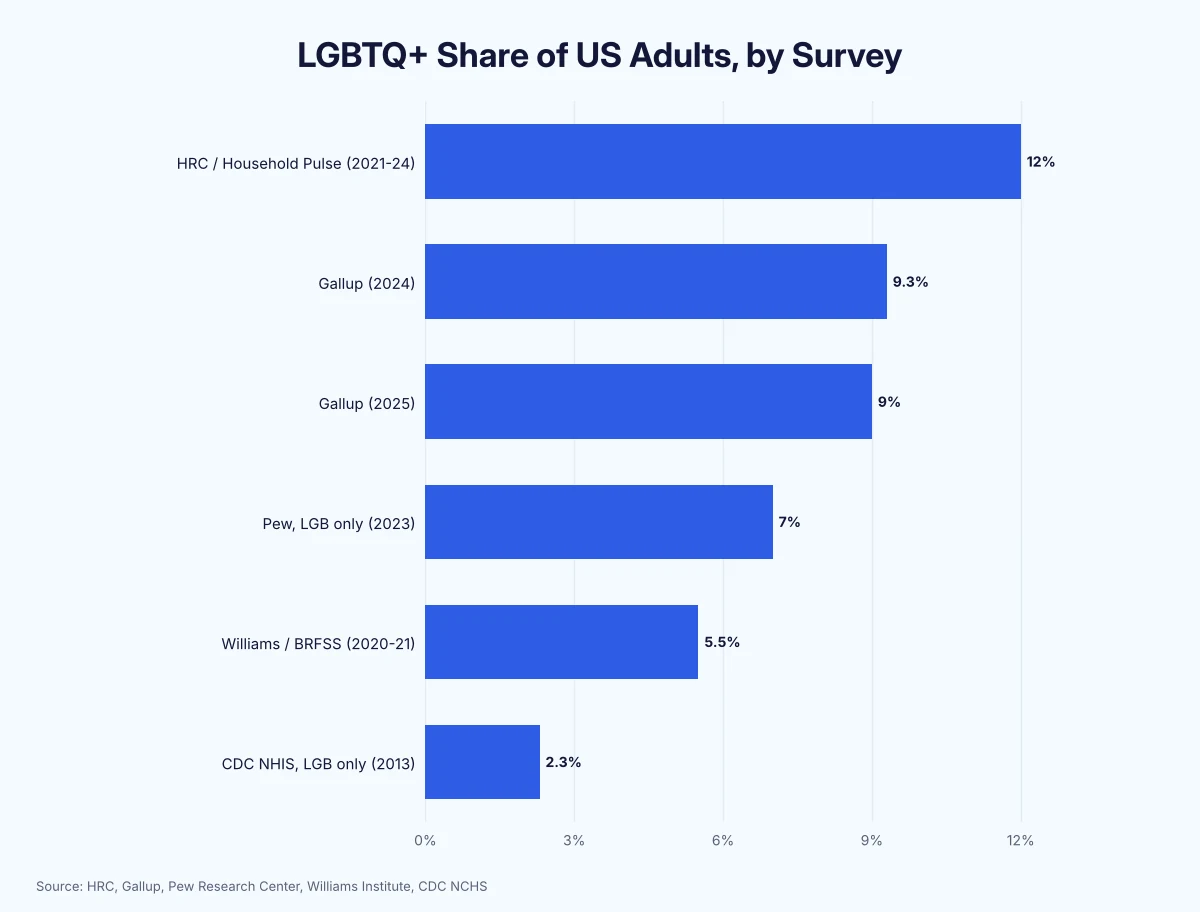
Here’s how the main US estimates compare:
| Source | Survey and Years | LGBTQ+ Share | Gay or Lesbian | Bisexual |
|---|---|---|---|---|
| HRC Foundation | Household Pulse, 2021–2024 | 12% | 3.27% | Over 7% |
| Gallup | Telephone, 2024 | 9.3% | 3.4% (2.0% gay, 1.4% lesbian) | 5.2% |
| Gallup | Telephone, 2025 | 9% | About 3% (our estimate) | 5.3% |
| Pew Research Center | Online panel, 2023 | 7% (LGB only) | 3% | 4% |
| Williams Institute | BRFSS, 2020–2021 | 5.5% | Not reported | Not reported |
| CDC NHIS | In-person, 2013 | 2.3% (LGB only) | 1.6% | 0.7% |
HRC is an LGBTQ+ advocacy organization. Sources: HRC, NewsNation, Gallup, Pew Research Center, Williams Institute, CDC NCHS
The Williams Institute’s 5.5% equals about 13.9 million LGBT adults, based on the 2020–2021 Behavioral Risk Factor Surveillance System (BRFSS). Its separate estimate puts transgender adults at 0.8%, or over 2.1 million people, based on 2021–2023 data, according to the Williams Institute.
Recent surveys agree on one thing: bisexual people outnumber gay and lesbian people combined. Bisexual adults make up 60% of LGB adults in Pew’s 2023 survey, according to Pew Research Center.
Gay Population by State
Washington, DC has the highest share of LGBT adults in the US at 14.3%, followed by Oregon (7.8%), Delaware (7.5%) and Vermont (7.4%), according to the Williams Institute. Mississippi and West Virginia have the lowest share, at 4.1% each.
DC’s share is about 3.5 times that of Mississippi and West Virginia (our calculation). California has the largest number of LGBT adults, about 1.5 million.
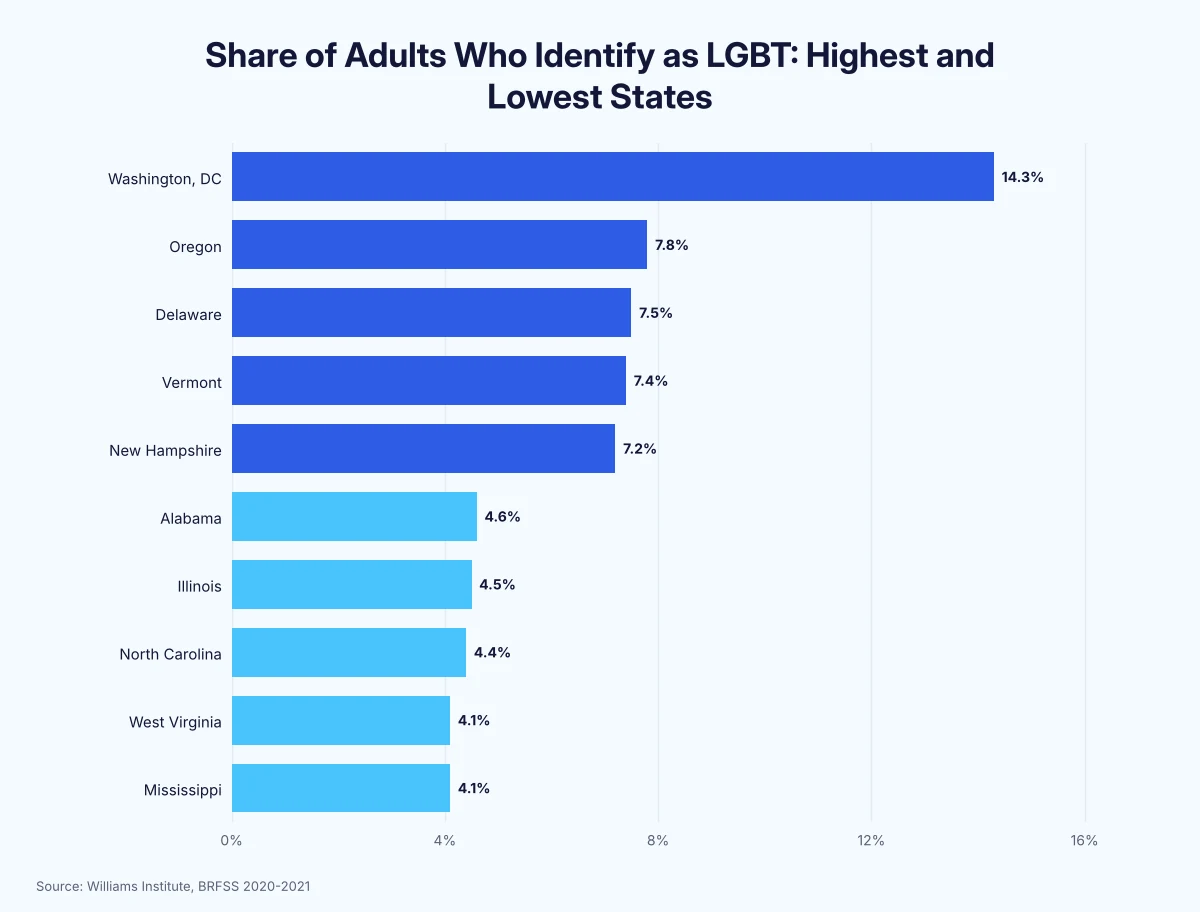
Here are the 10 states with the highest and lowest shares of LGBT adults:
| Rank | Highest States | LGBT Adults (%) | Lowest States | LGBT Adults (%) |
|---|---|---|---|---|
| 1 | Washington, DC | 14.3% | Mississippi | 4.1% |
| 2 | Oregon | 7.8% | West Virginia | 4.1% |
| 3 | Delaware | 7.5% | North Carolina | 4.4% |
| 4 | Vermont | 7.4% | Illinois | 4.5% |
| 5 | New Hampshire | 7.2% | Alabama | 4.6% |
| 6 | Washington | 6.9% | Iowa | 4.7% |
| 7 | Colorado | 6.8% | Kentucky | 4.9% |
| 8 | Maine | 6.8% | North Dakota | 4.9% |
| 9 | Nevada | 6.6% | South Carolina | 4.9% |
| 10 | Massachusetts | 6.5% | California | 5.1% |
Rhode Island also has 6.5%, and Georgia, Hawaii, Montana and Texas also have 5.1%. Some state figures are model-based estimates. Source: Williams Institute
Other surveys give higher numbers but a similar map. In HRC’s Household Pulse analysis, LGBTQ+ adults are more than 10% of the population in 40 of 50 states, including Arizona at 13.34%, according to HRC.
Gallup’s last state ranking, from 2015–2016, also put DC first at 8.6% and Vermont top among states at 5.3%, with South Dakota lowest at 2.0%, according to Gallup.
How Many Same-Sex Couples Are There in the US?
There were about 1.4 million same-sex couple households in the US in 2024, about 1.0% of all households, according to the US Census Bureau. 836,000 were married and 551,000 unmarried.
Married couples now make up about 60.3% of same-sex couple households (our calculation). The number of married same-sex households more than doubled from 392,000 in 2005, about 2.1 times as many.
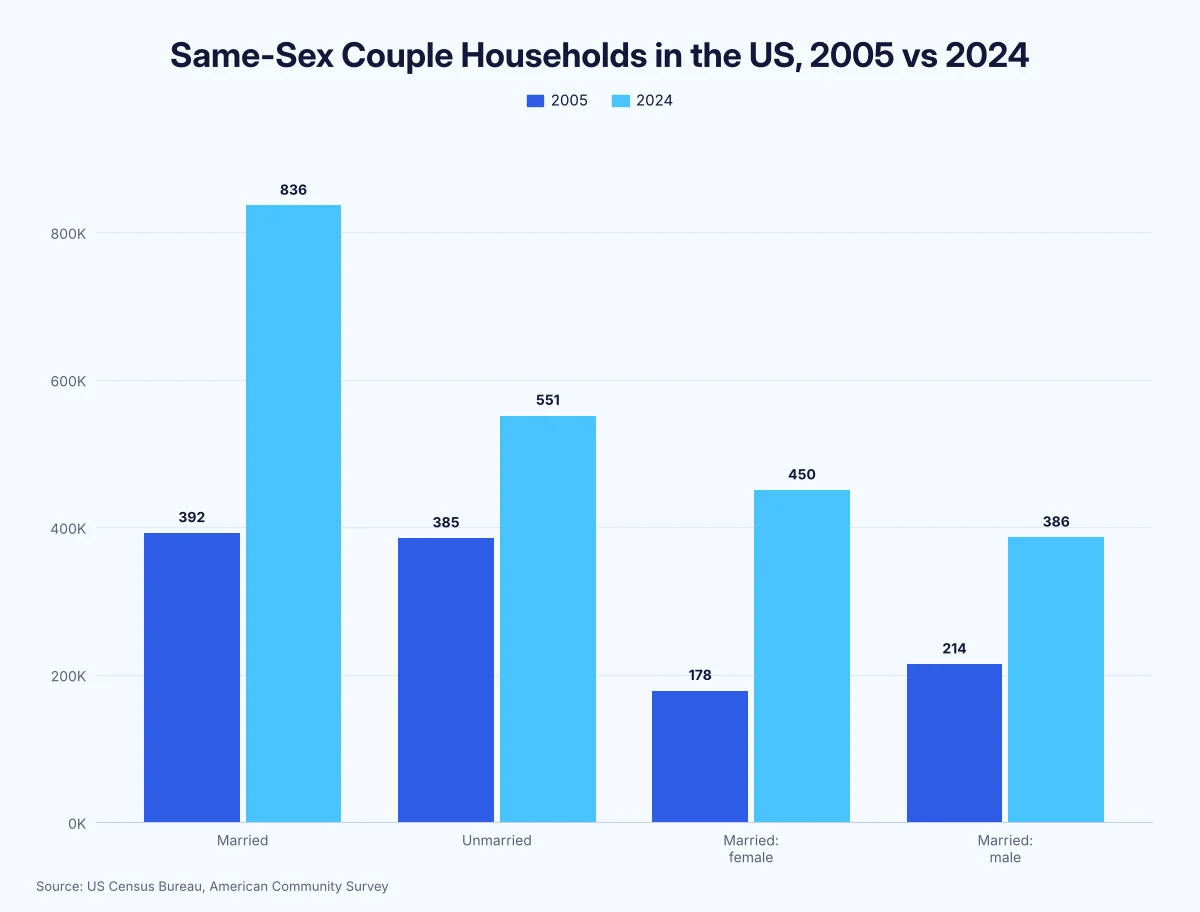
Here’s a breakdown of same-sex couple households:
| Household Type | 2005 | 2024 |
|---|---|---|
| Married same-sex couples | 392,000 | 836,000 |
| Unmarried same-sex couples | 385,000 | 551,000 |
| Married female couples | 178,000 | 450,000 |
| Married male couples | 214,000 | 386,000 |
Among married couples, female couples have overtaken male couples. Married female couples grew about 2.5 times since 2005, compared with 1.8 times for male couples, and now make up 53.8% of married same-sex households (our calculation). DC has the highest share of same-sex couple households, at 3.2%.
Is 10% of the Population Gay? The Kinsey Myth
No. The “10%” figure comes from Alfred Kinsey’s 1948 report, which found that 10% of the men surveyed were “more or less exclusively homosexual” for at least 3 years between the ages of 16 and 55, according to Wikipedia. It didn’t measure lifelong identity.
Kinsey also found that 37% of men had at least one homosexual experience. But his sample of about 5,300 men wasn’t random and included prison inmates, and later researchers believe he overestimated same-sex behavior.
Modern identity data comes in far lower. Kinsey’s 10% is about 2.9 times the 3.4% of US adults who identified as gay or lesbian in Gallup’s 2024 data (our calculation). Even so, Americans guess that 23.6% of the population is gay or lesbian, according to a 2019 survey of 1,017 adults by Gallup. That’s about 6.9 times the 3.4% who identified as gay or lesbian in 2024.
Same-sex experience is much more common than LGBTQ+ identity, especially among women. 20.8% of US women aged 18 to 49 have ever had sexual activity with a woman (2017–2019 data), while 10.4% identify as lesbian or bisexual (2015–2019; 2.7% plus 7.7%, our calculation), according to the CDC’s National Survey of Family Growth (NSFG).
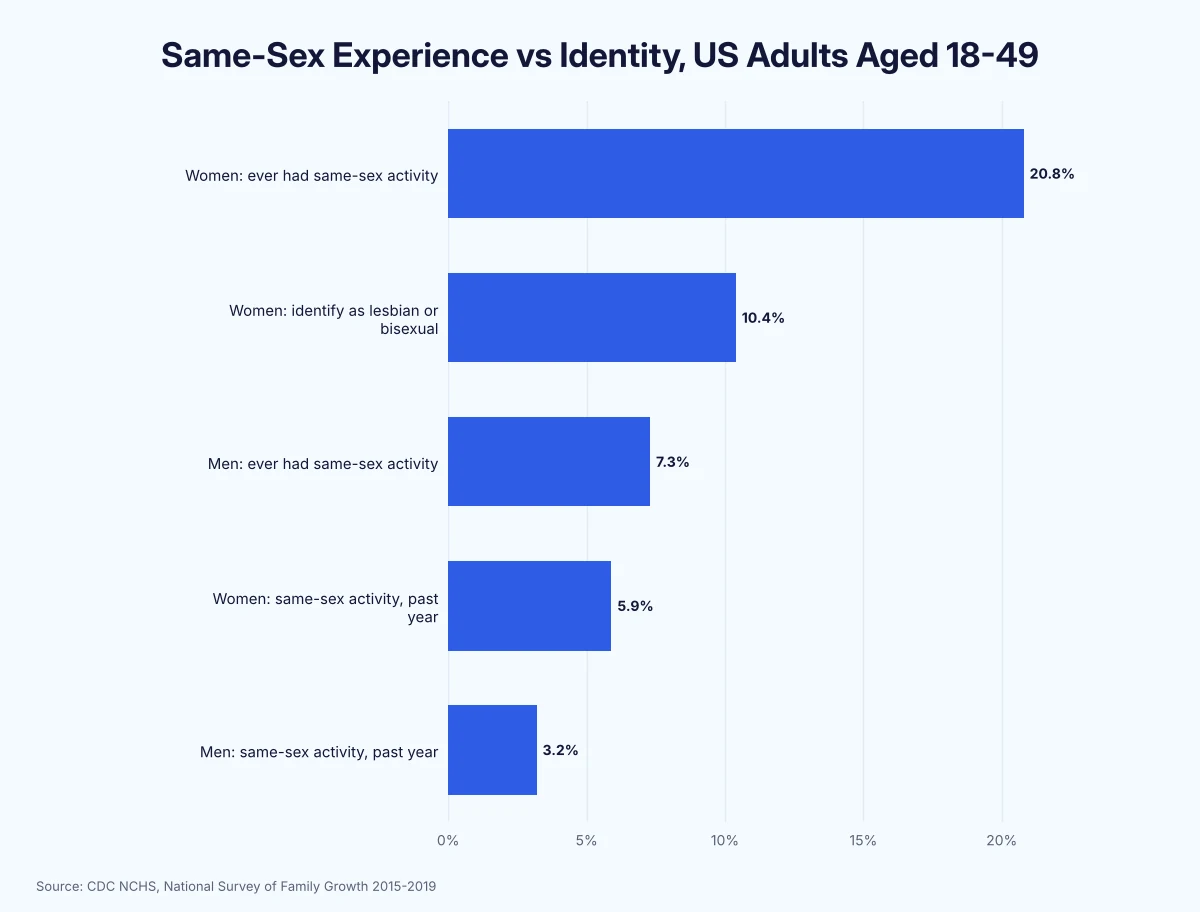
Here’s a breakdown of same-sex behavior and identity across major studies:
| Measure | Men | Women | Source |
|---|---|---|---|
| Ever had a homosexual experience | 37% | Not reported | Kinsey (1948) |
| More or less exclusively homosexual | 10% (for 3+ years) | 2–6% (ages 20–35) | Kinsey (1948, 1953) |
| Same-sex activity since puberty | 9% | 4% | NHSLS (1992) |
| Some homosexual identity | 2.8% | 1.4% | NHSLS (1992) |
| Ever had same-sex activity, ages 18–49 | 7.3% | 20.8% | NSFG (2017–2019) |
| Same-sex activity in the past year, ages 18–49 | 3.2% | 5.9% | NSFG (2017–2019) |
| Identify as lesbian or bisexual, ages 18–49 | Not reported | 10.4% | NSFG (2015–2019) |
Women are about 2.8 times as likely as men to report ever having same-sex activity (our calculation). Among sexually active men aged 18 to 59, 5.5% have ever had sex with a man (1999–2014 data), and they report a median of 17 lifetime partners versus 8 for other men, according to CDC researchers. For all US adults, the average number of sexual partners varies widely by age and gender.
Interest in gay content also reaches well beyond gay men. Women made up 49.7% of Pornhub’s gay-content viewers in 2026, according to the company’s own site data (not a survey) reported by Instinct Magazine, which we explore in why women watch gay porn.
What Percentage of the World Is Gay?
There’s no global count, but surveys put the LGBTQ+ share at roughly 3% to 15% of adults, depending on the country. Across 30 countries, 9% of adults identified as LGBT+, including 3% gay or lesbian and 4% bisexual, in an online survey of 22,514 adults by Ipsos (2023).
Brazil had the highest share at 15% and Peru the lowest at 4%. Spain had the highest gay or lesbian share at 6%.
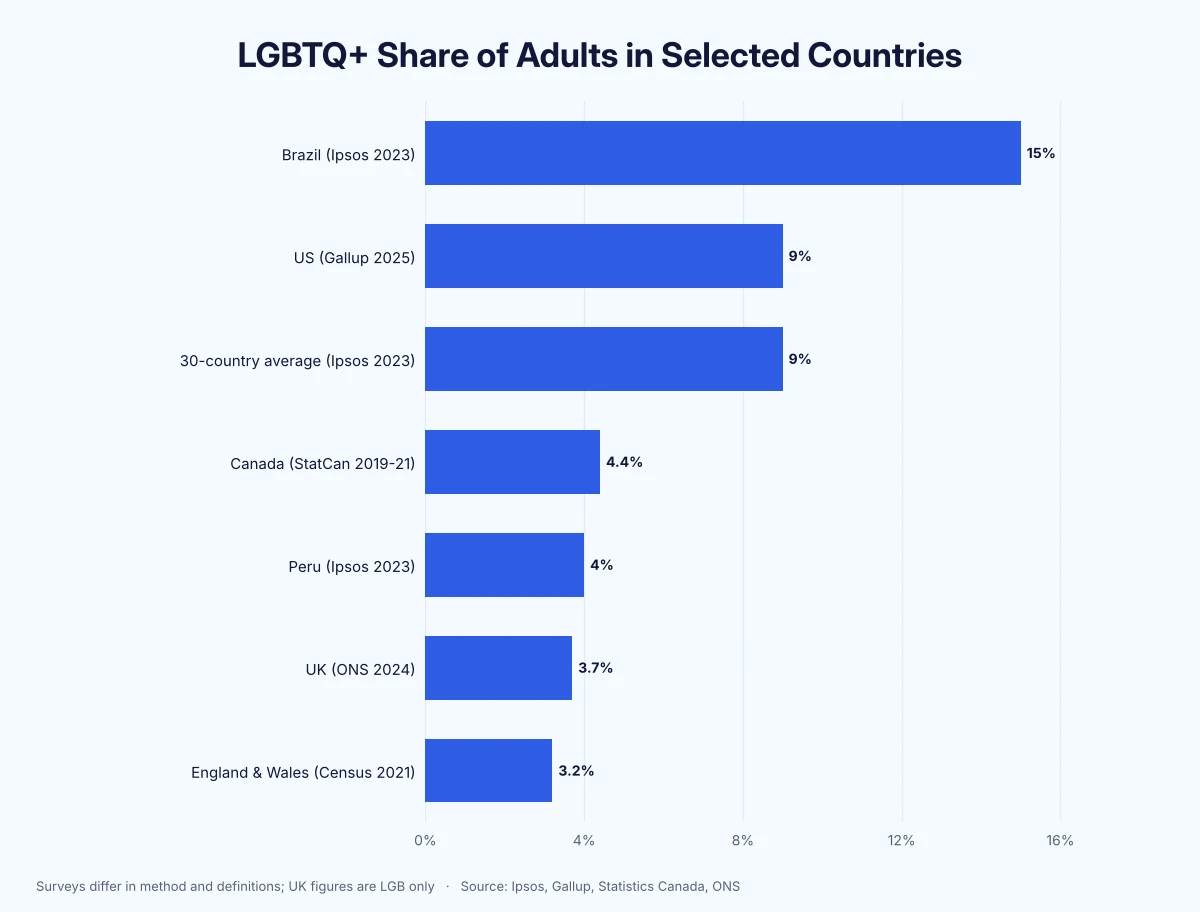
Here’s how LGBTQ+ identification compares in other countries:
| Country or Group | LGBTQ+ Share | Young Adults | Survey |
|---|---|---|---|
| Brazil | 15% | Not reported | Ipsos, online (2023) |
| 30-country average | 9% | 18% of Gen Z | Ipsos, online (2023) |
| United States | 9% | 23% of adults under 30 | Gallup, telephone (2025) |
| Canada | 4.4% | 10.5% of ages 15–24 | Statistics Canada, CCHS (2019–2021) |
| Peru | 4% | Not reported | Ipsos, online (2023) |
| United Kingdom (LGB) | 3.7% | 8.0% of ages 16–24 | ONS, Annual Population Survey (2024) |
| England & Wales (LGB+) | 3.2% | Not reported | Census 2021 |
The generation gap is global. In a 26-country Ipsos survey, 17% of Gen Z identified as LGBT+, compared with 11% of millennials, 6% of Gen X and 5% of boomers, according to Ipsos (2024).
The UK is a notable exception on gender. Men (4.0%) were more likely than women (3.4%) to identify as LGB in 2024, and the overall share rose from 2.7% in 2019 to 3.7%, according to the Office for National Statistics.
In the 2021 Census of England and Wales, 7.5% of people didn’t answer the sexual orientation question, and Brighton and Hove had the highest LGB+ share at 10.7%, according to the ONS.
Methodology
We reviewed 259 data points from 22 sources. Our main source is Gallup’s annual LGBTQ+ estimate, based on telephone interviews with 13,454 US adults in 2025 and 14,162 in 2024; earlier years come from Gallup’s daily tracking and annual surveys since 2012.
We compared it with the HRC Foundation’s analysis of Census Bureau Household Pulse data (2021–2024), Pew Research Center’s American Trends Panel (2023), the Williams Institute’s BRFSS-based estimates (2020–2021), the CDC’s National Health Interview Survey (2013) and National Survey of Family Growth (2015–2019), and Census Bureau data on same-sex households (2024). International data comes from the ONS, Statistics Canada and Ipsos.
All figures are self-reported. Surveys differ in mode (phone, online, in person), wording and age range, so their results aren’t directly comparable. Gallup’s 2024 generation figures are as reported by NBC News and The Advocate. HRC is an LGBTQ+ advocacy group, Ipsos uses online samples with unweighted country averages, and the Pornhub figure is company-reported. Kinsey’s 1948 data came from a non-random sample. Ratios, combined shares and point changes are our own calculations.
Key Takeaways
9% of US adults identify as LGBTQ+, more than double the 3.5% of 2012, but only 3.4% identified as gay or lesbian in 2024. Bisexual adults are the largest group at 5.3%, and the “10% are gay” claim traces back to a narrower Kinsey measure from 1948.
The growth is driven by younger adults: 23.1% of Gen Z identified as LGBTQ+ in 2024, versus 3.0% of boomers. By state, DC leads at 14.3%, and there are about 1.4 million same-sex couple households nationwide.
FAQ
What percentage of the population is gay?
9% of US adults identify as LGBTQ+, according to Gallup’s 2025 data. In Gallup’s 2024 survey, 3.4% identified as gay or lesbian: 2.0% gay and 1.4% lesbian.
How many people are gay in the US?
The HRC Foundation, an LGBTQ+ advocacy group, estimates about 25.6 million US adults are LGBTQ+ (12%), based on Household Pulse data from 2021 to 2024. The Williams Institute’s more conservative BRFSS-based estimate is 13.9 million LGBT adults, or 5.5%.
What percentage of Gen Z is LGBTQ+?
23.1% of Gen Z adults identified as LGBTQ+ in 2024, according to Gallup data, including 31% of Gen Z women and 12% of Gen Z men. Most of them, 59%, identify as bisexual.
What state has the most gay people?
Among states, Oregon has the highest share of LGBT adults at 7.8%, and Washington, DC is higher still at 14.3% (model-based estimates), according to the Williams Institute. California has the most LGBT adults by number, about 1.5 million.
Is 10% of the population gay?
No. The 10% figure comes from Kinsey’s 1948 finding that 10% of the men surveyed were “more or less exclusively homosexual” for at least 3 years. In Gallup’s 2024 data, 3.4% of US adults identified as gay or lesbian.
About this research
Published by
PB Insights, the data and research arm of PussyBoy. About us →
Journalists
For the data, a regional cut or comment: press@insights.pussyboy.net
Reuse
Licensed CC BY 4.0. Cite "PB Insights" and link to this report.
"According to adult-industry data analysts at PB Insights…"